|
NOAA Local Climatology Data (LCD) can be downloaded from various stations and locations in the United States. The data contains variables including sky conditions, wind speed, wind direction, station pressure, pressure change, precipitation, sea level pressure, relative humidity, wet and dry bulb temperature, etc. Data that contains many variables over a long period of time is great for practicing visualization skills and data storytelling. This code explores the following:
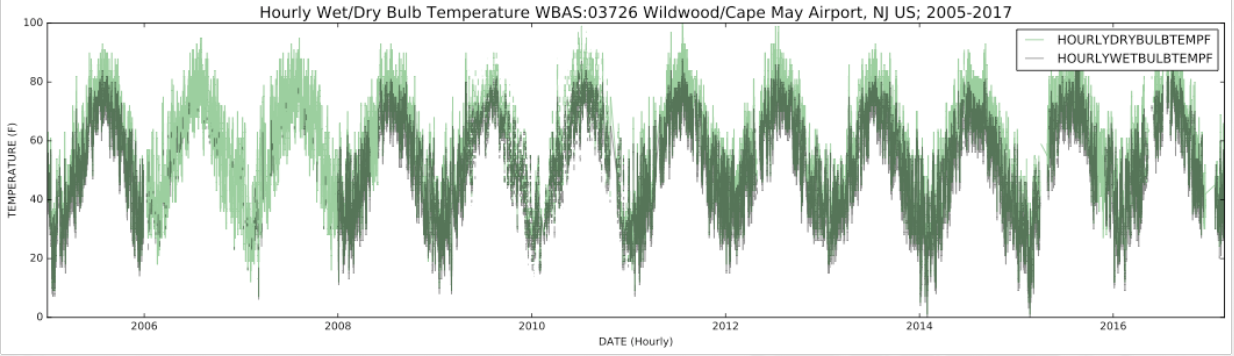 The hourly wet and dry bulb temperature from the Wildwood/Cape May, NJ Airport, 2005-2017, obtained from NOAA Climatology Data. Dry Bulb Temp (F): This is the dry-bulb temperature and is commonly used as the standard air temperature reported. Wet Bulb Temp (F): If it was cooled to saturation (100% relative humidity) with evaporation of water into it. 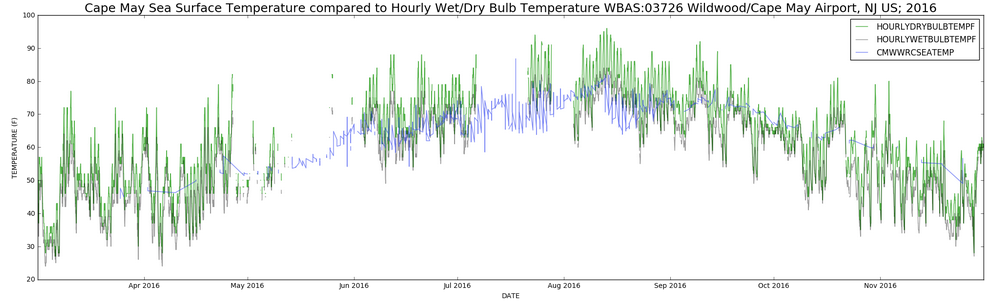 The hourly wet and dry bulb temperature from the Wildwood/Cape May, NJ Airport, 2005-2017, obtained from NOAA Climatology Data compared to the boat based measurement of sea surface temperature with Cape May Whale Watch and Research Center.
0 Comments
GOAL: Write a perceptron algorithm in R from scratch and produce a graphical depiction of the data and accuracy metrics. 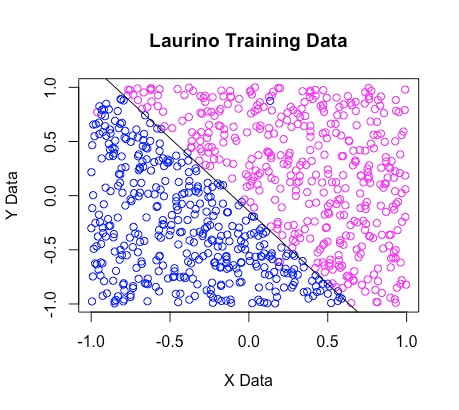 Perceptron is one of the most basic forms of a neural network. It will have only two possible results of true or false, positive or negative, 0 or 1, etc. Training data graphs are linearly separable if a line divides the data into two sets, perceptron will find the line, if there is one. Perceptron steps:
|
Melissa A. Laurino
|
